Source data
A CSV containing the game fields used in the analysis.
Data / LobbyPick Analytics
I used a 28-game sample from LobbyPick's catalog to practice SQL analysis and turn the results into a one-page Power BI dashboard.
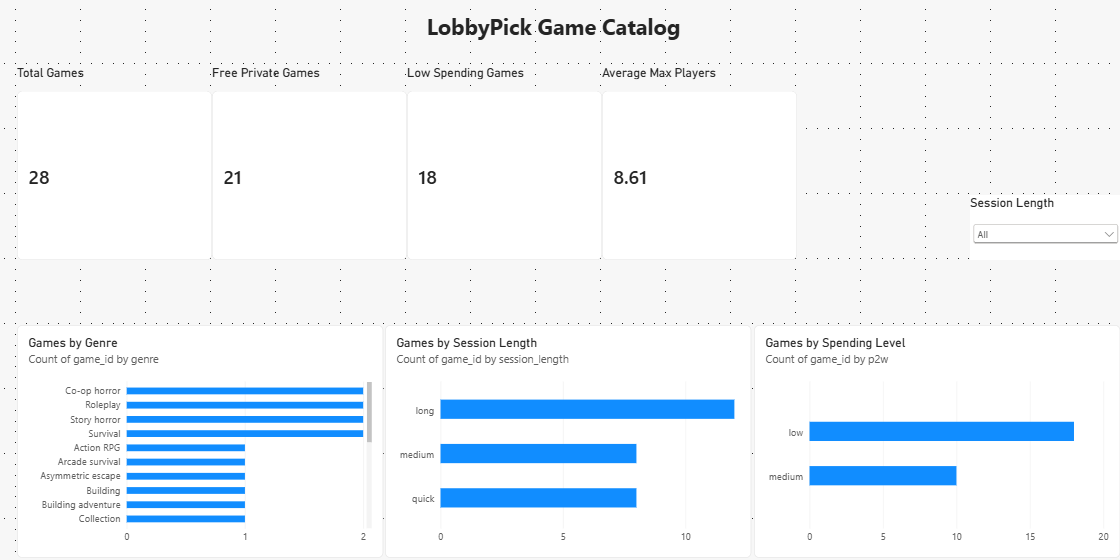
Power BI dashboard preview from the project file. It summarizes catalog size, free private games, low-spending games, average max players, and category breakdowns.
01
02
I created the table setup and basic queries using filters, grouping, counts, and averages. The queries cover genre counts, mobile support, group-of-four compatibility, session length, spending level, free private servers, and average maximum players by genre.
03
The dashboard uses KPI cards, bar charts, and a session-length slicer. The project reports 28 total games, 21 with free private servers, 18 low-spending games, and an average maximum-player value of 8.61.
A CSV containing the game fields used in the analysis.
SQL queries for filtering, grouping, counts, and averages.
A one-page Power BI report with basic DAX measures.